
Judging by the number of new, laboratory-confirmed SARS-CoV-2 infections, and using the formula the Ministerial Advisory Committee (MAC) used previously to calculate if a new COVID wave has started, South Africa moved into a fifth COVID wave on 7 May.
But not all scientists agree – or say that it matters that much.
The MAC formula says when the seven-day moving average of new cases exceeds 30% of the peak of the previous wave, we are in a new wave, reports Bhekisisa.
The seven-day moving average is when you add up the past seven days of new cases, divide them by seven and repeat that calculation for each new day so you can plot all seven-day averages on a graph. Because there would be a new seven-day average for each day, it is called a “moving” average.
The data journalism organisation, Media Hack, has calculated that the peak of SA’s previous (fourth) wave was on 17 December with 20,791 new infections: 30% of that is 6,237 infections. SA therefore tipped over that edge on 7 May, when the seven-day moving average was 6,282 infections, signalling a new wave.
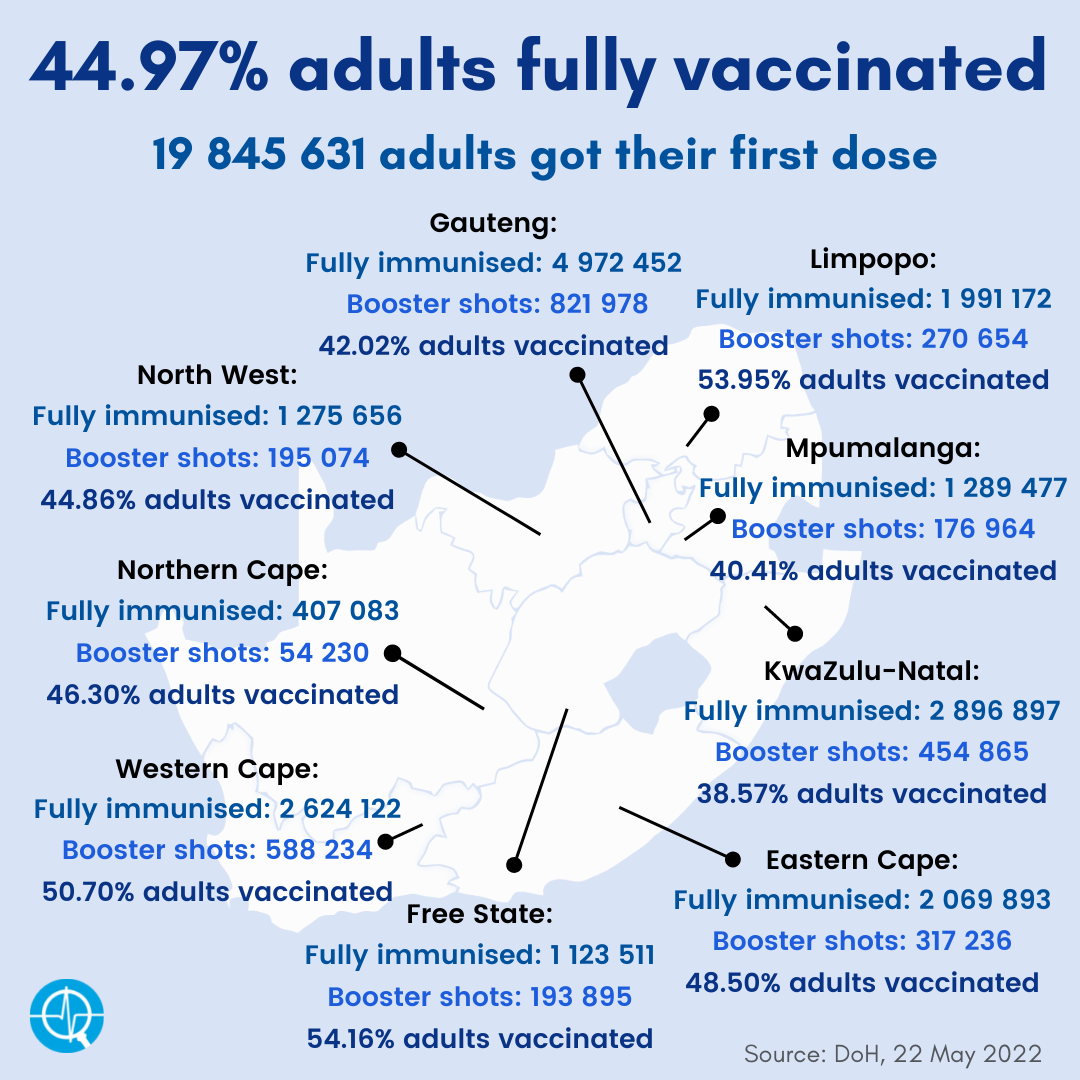
But, as Media Hack reports, on a provincial level, only the Northern Cape and Western Cape had seven-day moving averages by 15 May. Although the Free State (13 May), Gauteng (11 May) and KZN (6 May) had reached this mark in May, their seven-day averages dropped below 30% again by 15 May. Limpopo, Mpumalanga and Northwest have not yet entered their fifth waves.
What is driving the current surge?
The Omicron variant, which drove our fourth wave, is also driving the current surge in infections, but this one is fuelled by different forms of Omicron. During our fourth wave, BA.1 was the main form of the virus circulating, but then BA.2 took over and caused a rise in infections.
In mid-January, yet another sub-variant, BA.4, was detected in Limpopo, and in February, another, BA.5, in KZN. BA.4 and BA.5 have since been picked up countrywide, and in April more than half of the COVID test result samples scientists analysed were BA.4 and BA.5.
Meanwhile, there are signs that the BA.4/BA.5-driven surge is flattening out, researcher Ridhwaan Suliman reports, with the average proportion of COVID tests coming out positive at a “steady 24%”.
The numbers say we’re in a fifth wave, but are we?
The question now, say National Institute for Communicable Diseases (NICD) scientists, is: Are the formulas used to calculate the beginning of previous waves still relevant and can we trust the results?
Head of the NICD’s division of public health surveillance and response Michelle Groome says probably not.
First, testing patterns have changed, making it hard to reliably compare current testing data with previous waves’ testing numbers.
And fewer people are testing. “People who have been vaccinated and/or had COVID no longer get tested when they get sick. So testing rates are low,” says Groome.
Rapid antigen tests, compared with PCR tests only, are also used more widely. Because rapid test results do not need laboratory analysis, as did PCR tests, those conducting the tests often do not report the results to the National Health Laboratory Service, which records results.
Epidemiologist Salim Abdool Karim says fewer people are testing since they may not realise they’re ill. “Most infections are either asymptomatic or mildly symptomatic.”
With no new variant and because cases during the interwave period between the fourth and fifth wave never returned to the low levels between other waves, “we could technically even argue SA is still in the fourth wave”, says Groome.
The pace at which new infections, hospitalisations and deaths have been increasing during this surge is also much slower than during the initial Omicron (BA.1) surge.
Which COVID numbers are now meaningful?
Groome says case numbers have become less meaningful: “Severe outcomes like hospitalisations and deaths are better metrics now that we have seen the decoupling of cases and severe outcomes.”
So what we now want to monitor is whether — and when — new infections will put strain on our health system because of hospital admissions, rather than the number of new cases.”
A reported, 9,557 people in SA died of COVID-19 between 1 January and 15 May. The South African Medical Research Council (SAMRC) estimates that at least 85% of excess deaths can also be attributed to COVID. Excess deaths is a figure telling researchers how many more people died in a certain period than those expected, adds Bhekisisa. This figure includes the Health Department’s COVID death count, and the extra unexpected deaths reported to Home Affairs’ population register.
Since the start of the pandemic, the SAMRC and University of Cape Town researchers have tallied 311,066 excess deaths and say between 85% and 95% of excess deaths are probably the real COVID death count (so between 264,000 and 295,512).
Compare just the official death count so far this year to other respiratory infections such as the flu. The NICD says flu annually kills between 6,000 and 11,000 people in SA. COVID caused 62,258 reported deaths in 2021 — more than five times higher than flu deaths (using the upper range of flu casualties). Say flu only causes 6,000 deaths in a year, then COVID deaths are still 10 times more.
Says Abdool Karim: “We should be trying to prevent and/or slow the spread of infection as every person who does not get infected is saved from the risk of not only acute infection consequences but its many long-term consequences.”
Bhekisisa article – What the latest COVID stats can tell us – and what they can’t (Open access)
MediaHack The Outlier article – Two years of coronavirus in SA (Open access)
See more from MedicalBrief archives:
Tests and wastewater analyses signal a possible 5th wave in SA
New dashboard lets public track COVID levels in local sewerage systems
NICD statistics: COVID cases rise as two Omicron sub-lineages spread across SA
Omicron variant: Clinical severity and hospitalisation profile in South Africa
NICD: Positivity rate spikes after COVID test results delay at state labs