
 The University of Glasgow's Sir Graham Teasdale, co-creator of the Glasgow Coma Scale, has teamed up with Paul M Brennan and Gordon D Murray of the University of Edinburgh to create new assessment tools that build on the Glasgow Coma Scale to provide greater information on injury severity and prognosis in patients with traumatic brain injury (TBI) while still offering simplicity of use.
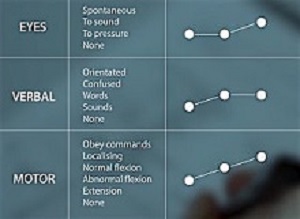
The Glasgow Coma Scale (GCS) was first introduced in 1974 by Bryan Jennett and Graham Teasdale to assess coma and impaired consciousness. The scale describes variations in three clinical features: the patient's eye, motor, and verbal responses.
The authors assigned numerical scores to each feature depending on the quality of the response. GCS total scores (including eye + motor + verbal responses) range from 3 (deep coma) to 15 (full consciousness). The scale is used throughout the world by physicians, nurses, and emergency medical technicians.
Other researchers have designed methods to evaluate patients with TBI and predict outcomes based on a variety of factors, but many of these methods have been complex and have not been readily accepted in the clinical setting. The arrival of a patient with TBI at an emergency department requires rapid injury assessment that is readily communicable to other healthcare workers. The tools offered in these articles provide just that.
In the first paper, Brennan, Murray, and Teasdale describe the development of the Glasgow Coma Scale-Pupils score (GCS-P), a simple but elegant tool that extends the information collected by the GCS score on the severity of TBI. The authors examined the relationships between GCS scores and pupils' reaction to light as well as the relationships between these factors and patient outcome 6 months after injury. To do this, they examined data from CRASH[1] and IMPACT[2], the two largest databases containing information on individual patients with TBI.
To create the GCS-P, the authors first established a pupil reactivity score, which represents the number of nonreactive pupils (0, 1, or 2). This number is subtracted from the GCS score (3-15), resulting in the GCS-P (1-15).
The authors state that pupil reactivity and the GCS score are the two clinical features that provide the most information about prognosis in head-injured patients. Combining the two together provides greater information about injury severity and prognosis than using the GCS score alone, particularly in cases of severe head injury (GCS scores 3-8), in which nonreactive pupils are more common.
Brennan, Murray, and Teasdale point out that adoption of assessment tools works better if the tools are simple and user friendly. Nevertheless, they examined other, more complicated models of combining the GCS score and pupil reactivity to see if those models yielded more predictive information about outcomes in patients with TBI. The authors found that the simple arithmetically derived GCS-P performed almost as well as other, more complex methods. Plus, it has the advantage of being simple to apply and easy to communicate to others.
In the second study, Murray, Brennan, and Teasdale show how other factors can be added to the Glasgow Coma Scale-Pupils score (GCS-P) to further increase predictive information on patient outcome. The clinical features comprising the Glasgow Coma Scale, pupil reactivity, patient age, and computed tomography (CT) findings have all separately been found to have bearing on patient outcome after neurological trauma. These factors have been validated in earlier studies to be the most important prognostic characteristics in head-injured patients.
Again, the authors sought a way to combine patient features into a more comprehensive assessment tool that would be simple to apply and whose information yield could be easily communicated to others. Using CRASH and IMPACT data, Murray, Brennan, and Teasdale combined the patient's early GCS score, pupil reactivity, age, and CT findings, and developed a series of graphic representations that clearly display the risks of death and probabilities of favourable outcomes in patients with brain injury.
First, the authors observed the additive effect on outcome that occurs when age is added to the patient's admission GCS-P. The risk of death after TBI increases as patient age advances, and at all ages the risk of death increases as the GCS-P decreases. The probability of favourable outcome is greater in younger patients and in patients with higher GCS-Ps. The authors created two prediction charts based on the GCS-P and patient age stratified into 5-year increments (GCS-PA charts): one chart clearly shows risks of death and the other chart probabilities of favourable outcomes in patients 6 months after TBI.
Following this, the authors added information obtained from CT scans when available. They were able to simplify three different abnormal CT findings into scores based solely on the number of abnormalities. They then created two sets of three predictive charts based on the GCS-P plus patient age and number of CT abnormalities (GCS-PA CT charts). One set of charts follows probabilities of death 6 months after injury, while the other set follows probabilities of favourable outcome at the same time point. These charts can be used by clinicians in decision making and in communicating predictive information to other clinicians, patients, and caregivers.
The authors state that these methods of assessing injury and potential outcomes in patients with TBI should not be used alone when managing an individual case. Individual patients all have unique characteristics, which together influence outcome. Nevertheless, the GCS-P and predictive charts that also include age and CT findings provide important objective information that is simple to apply and can be used to assist decision making and communicate risks to others.
When asked about these important studies, the authors responded, "Decisions about patient care in the immediate aftermath of a head injury are influenced by physician perceptions of the patient's likely outcome, so it's important that assumptions that underlie these decisions are correct. Working together between Glasgow and Edinburgh, we have developed the GCS-P and associated prognostic charts. These simple and easy to use tools provide reliable estimates of outcomes at 6 months and will support clinician decision making in neurotrauma."
Abstract 1
Objective: Glasgow Coma Scale (GCS) scores and pupil responses are key indicators of the severity of traumatic brain damage. The aim of this study was to determine what information would be gained by combining these indicators into a single index and to explore the merits of different ways of achieving this.
Methods: Information about early GCS scores, pupil responses, late outcomes on the Glasgow Outcome Scale, and mortality were obtained at the individual patient level by reviewing data from the CRASH (Corticosteroid Randomisation After Significant Head Injury; n = 9,045) study and the IMPACT (International Mission for Prognosis and Clinical Trials in TBI; n = 6855) database. These data were combined into a pooled data set for the main analysis.
Methods of combining the Glasgow Coma Scale and pupil response data varied in complexity from using a simple arithmetic score (GCS score [range 3–15] minus the number of nonreacting pupils [0, 1, or 2]), which we call the GCS-Pupils score (GCS-P; range 1–15), to treating each factor as a separate categorical variable. The content of information about patient outcome in each of these models was evaluated using Nagelkerke’s R2.
Results: Separately, the GCS score and pupil response were each related to outcome. Adding information about the pupil response to the GCS score increased the information yield. The performance of the simple GCS-P was similar to the performance of more complex methods of evaluating traumatic brain damage. The relationship between decreases in the GCS-P and deteriorating outcome was seen across the complete range of possible scores. The additional 2 lowest points offered by the GCS-Pupils scale (GCS-P 1 and 2) extended the information about injury severity from a mortality rate of 51% and an unfavorable outcome rate of 70% at GCS score 3 to a mortality rate of 74% and an unfavorable outcome rate of 90% at GCS-P 1. The paradoxical finding that GCS score 4 was associated with a worse outcome than GCS score 3 was not seen when using the GCS-P.
Conclusions: A simple arithmetic combination of the GCS score and pupillary response, the GCS-P, extends the information provided about patient outcome to an extent comparable to that obtained using more complex methods. The greater range of injury severities that are identified and the smoothness of the stepwise pattern of outcomes across the range of scores may be useful in evaluating individual patients and identifying patient subgroups. The GCS-P may be a useful platform onto which information about other key prognostic features can be added in a simple format likely to be useful in clinical practice.
Authors
Paul M Brennan, Gordon D Murray, Graham M Teasdale
Abstract 2
Objective: Clinical features such as those included in the Glasgow Coma Scale (GCS) score, pupil reactivity, and patient age, as well as CT findings, have clear established relationships with patient outcomes due to neurotrauma. Nevertheless, predictions made from combining these features in probabilistic models have not found a role in clinical practice. In this study, the authors aimed to develop a method of displaying probabilities graphically that would be simple and easy to use, thus improving the usefulness of prognostic information in neurotrauma. This work builds on a companion paper describing the GCS-Pupils score (GCS-P) as a tool for assessing the clinical severity of neurotrauma.
Methods: Information about early GCS score, pupil response, patient age, CT findings, late outcome according to the Glasgow Outcome Scale, and mortality were obtained at the individual adult patient level from the CRASH (Corticosteroid Randomisation After Significant Head Injury; n = 9045) and IMPACT (International Mission for Prognosis and Clinical Trials in TBI; n = 6855) databases. These data were combined into a pooled data set for the main analysis. Logistic regression was first used to model the combined association between the GCS-P and patient age and outcome, following which CT findings were added to the models. The proportion of variability in outcomes “explained” by each model was assessed using Nagelkerke’s R2.
Results: The authors observed that patient age and GCS-P have an additive effect on outcome. The probability of mortality 6 months after neurotrauma is greater with increasing age, and for all age groups the probability of death is greater with decreasing GCS-P. Conversely, the probability of favorable recovery becomes lower with increasing age and lessens with decreasing GCS-P. The effect of combining the GCS-P with patient age was substantially more informative than the GCS-P, age, GCS score, or pupil reactivity alone. Two-dimensional charts were produced displaying outcome probabilities, as percentages, for 5-year increments in age between 15 and 85 years, and for GCS-Ps ranging from 1 to 15; it is readily seen that the movement toward combinations at the top right of the charts reflects a decreasing likelihood of mortality and an increasing likelihood of favorable outcome.
Analysis of CT findings showed that differences in outcome are very similar between patients with or without a hematoma, absent cisterns, or subarachnoid hemorrhage. Taken in combination, there is a gradation in risk that aligns with increasing numbers of any of these abnormalities. This information provides added value over age and GCS-P alone, supporting a simple extension of the earlier prognostic charts by stratifying the original charts in the following 3 CT groupings: none, only 1, and 2 or more CT abnormalities.
Conclusions: The important prognostic features in neurotrauma can be brought together to display graphically their combined effects on risks of death or on prospects for independent recovery. This approach can support decision making and improve communication of risk among health care professionals, patients, and their relatives. These charts will not replace clinical judgment, but they will reduce the risk of influences from biases.
Authors
Gordon D Murray, Paul M Brennan, Graham M Teasdale
[link url="https://www.sciencedaily.com/releases/2018/04/180410084248.htm"]Journal of Neurosurgery Publishing Group material[/link]
[link url="http://thejns.org/doi/10.3171/2017.12.JNS172780"]Journal of Neurosurgery abstract 1[/link]
[link url="http://thejns.org/doi/10.3171/2017.12.JNS172782"]Journal of Neurosurgery abstract 2[/link]