
Over the last decade there have been significant decreases in the rates of new HIV infections, HIV-related deaths, and mother-to-child transmission (MTCT) in South Africa.
Using estimates from the Thembisa mathematical model of HIV in South Africa, a Spotlight report has produced the following seven graphs to explore some of these nuances. Thembisa is the official source for UNAIDS’s HIV estimates for South Africa.
HIV Incidence in Young Women and Girls (Aged 15 to 24) vs. Young Men and Boys (Aged 15 to 24)
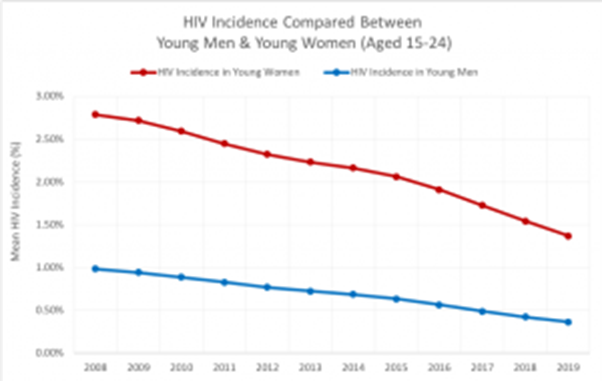
This graph shows the incidence from 2008 to 2019 in young women and girls aged 15 to 24 (Red Line) compared to young men and boys in the same age group (Blue Line). It is clear from the graph that incidence in women and girls in this age group has constantly been higher than that in boys and young men.
HIV Incidence in Young Women and Girls (Aged 15 to 24) vs. Older Women (Aged 25 to 49)
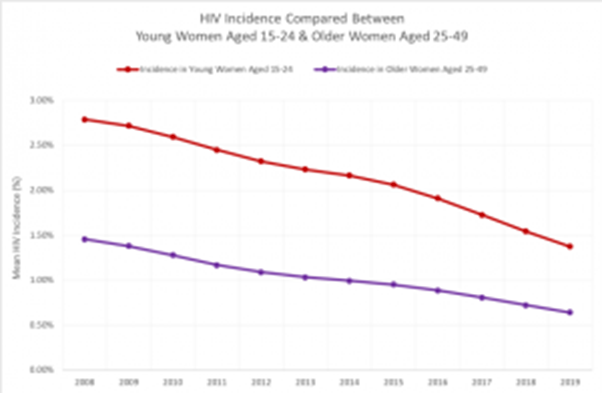
A woman’s risk for acquiring a new HIV infection changes with age. The graph above shows the difference in incidence between young women and girls aged 15 to 24 (Red Line) and older women aged 25 to 49 (Purple Line) over the time period from 2008 to 2019.
Rates of Condom Use
This graph shows the percentage of condom use at last sexual encounter in young women and girls aged 15 to 24 (Red Line) and older women aged 25 to 49 (Purple Line)) from 2008 to 2019. Older women are clearly more likely than younger women to use condoms, but the percentage is levelling off.
Getting Tested: Women vs. Men on Reaching the First UNAIDS 90-90-90 Target
The first UNAIDS 90-90-90 target states that by 2020 90% of people living with HIV should know their HIV status by receiving a positive HIV diagnosis. This graph shows that while here has been a steady increase in the percentage of people living with HIV who know their status, there has also been persistent differences between men and women – with men being less likely to get tested for HIV and the percentage of men living with HIV who know their status accordingly being lower than the percentage in women.
Diagnosed and on ART: Women vs. Men on Reaching the Second UNAIDS 90-90-90 Target
The second UNAIDS 90-90-90 target states that by 2020 90% of all individuals who have been diagnosed with HIV will be on sustained antiretroviral therapy (ART).
This graph shows the percentage of HIV-diagnosed men who are on ART (Blue Line) and women (Red Line) from 2008 to 2019. Both groups are well behind the UNAIDS target of 90% of HIV-positive individuals being on sustained ART and neither group, nor men and women combined will make the target by the end of 2020.
Reduction in MTCT Rates Over Time
The first graph above shows the overall mother-to-child transmission rate for the period from 2008 to 2019. It clearly shows the remarkable impact that the provision of ART to pregnant women living with HIV has had in reducing transmission. In 2018 there was an estimated MTCT rate of 4.06% in South Africa compared to 17.28% in 2008.
This second graph untangles the MTCT rate based on the timing of transmission to the child. The purple line shows MTCT at or before birth from an HIV-Diagnosed mother, whereas the pink line shows the Postnatal MTCT rate to 18 months from an HIV-diagnosed mother.
Children Living with HIV
This graph shows the change in absolute number of new HIV infections in children that are under the age of 15 from 2008 to 2019.
[link url="https://www.spotlightnsp.co.za/2020/02/12/nuances-in-sas-hiv-epidemic-seven-graphs-that-tell-the-story/"]Full Spotlight report[/link]